
Overview
This article will take you through using Grid Reporting and Make-Up Tables.
Specifically, the KiwiSaver Contribution Rates.
Grid reporting enables you to generate quick reports on an ad-hoc basis or as a report that is run frequently.
A grid report is a report generated from any entity or makeup table. This reporting option lets you print specific data based on the current grid layout.
A grid report enables you to sort and group data, and then generates a report based on what is displayed. The difference between a grid report and a standard report is that you can determine exactly what information is shown, and how it is to be sorted. Standard reports are run from the Report Group entity and have less flexibility in changing the report layout.
Make-up Tables are records that are attached to other Tables.
KiwiSaver Contribution/Superannuation Rates
In this example we will look at the Employee Super Fund Make-up Table data.
The Employee Super Fund Make-up Table contains the details of each Super Fund record from any given employee’s Superannuation tab (Payroll > Payroll > Superannuation)
For a Grid Report of KiwiSaver Contribution/Superannuation Rates you will need to get to the Make-up Table for the Employee Super Funds.
Go to Employee Details > Payroll > Employee Super Funds:
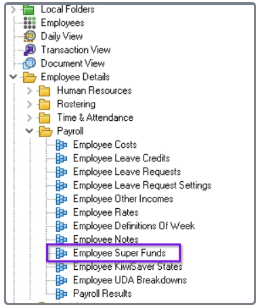
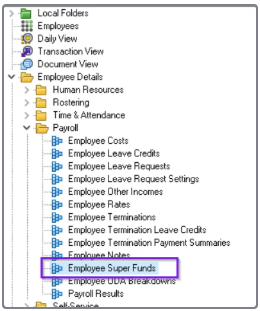
You will be able to Right-Click in the main section and select Customise Columns to add additional columns to the current grid.
For columns specific to the Employee record like the Termination Date or Start date can be found under the Employee Code Available column.
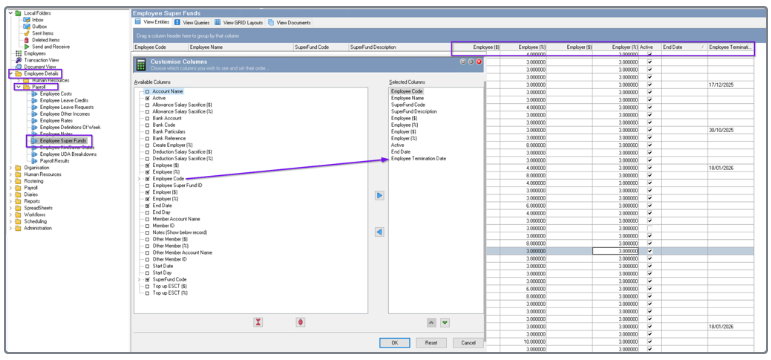
Depending on what information you require, you will be able to use the filters on specific columns to isolate the data for the required report.
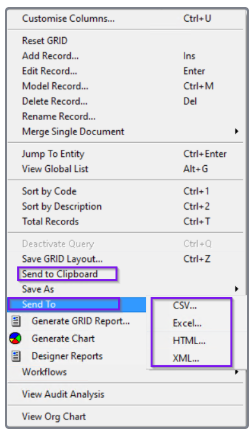
Once you have the information you require, you can export the information using multiple options by right-clicking on the data and selecting one of the multiple “Send to…” options.
Related articles
Visit Grid layouts, grid reports and make-up tables for the video.