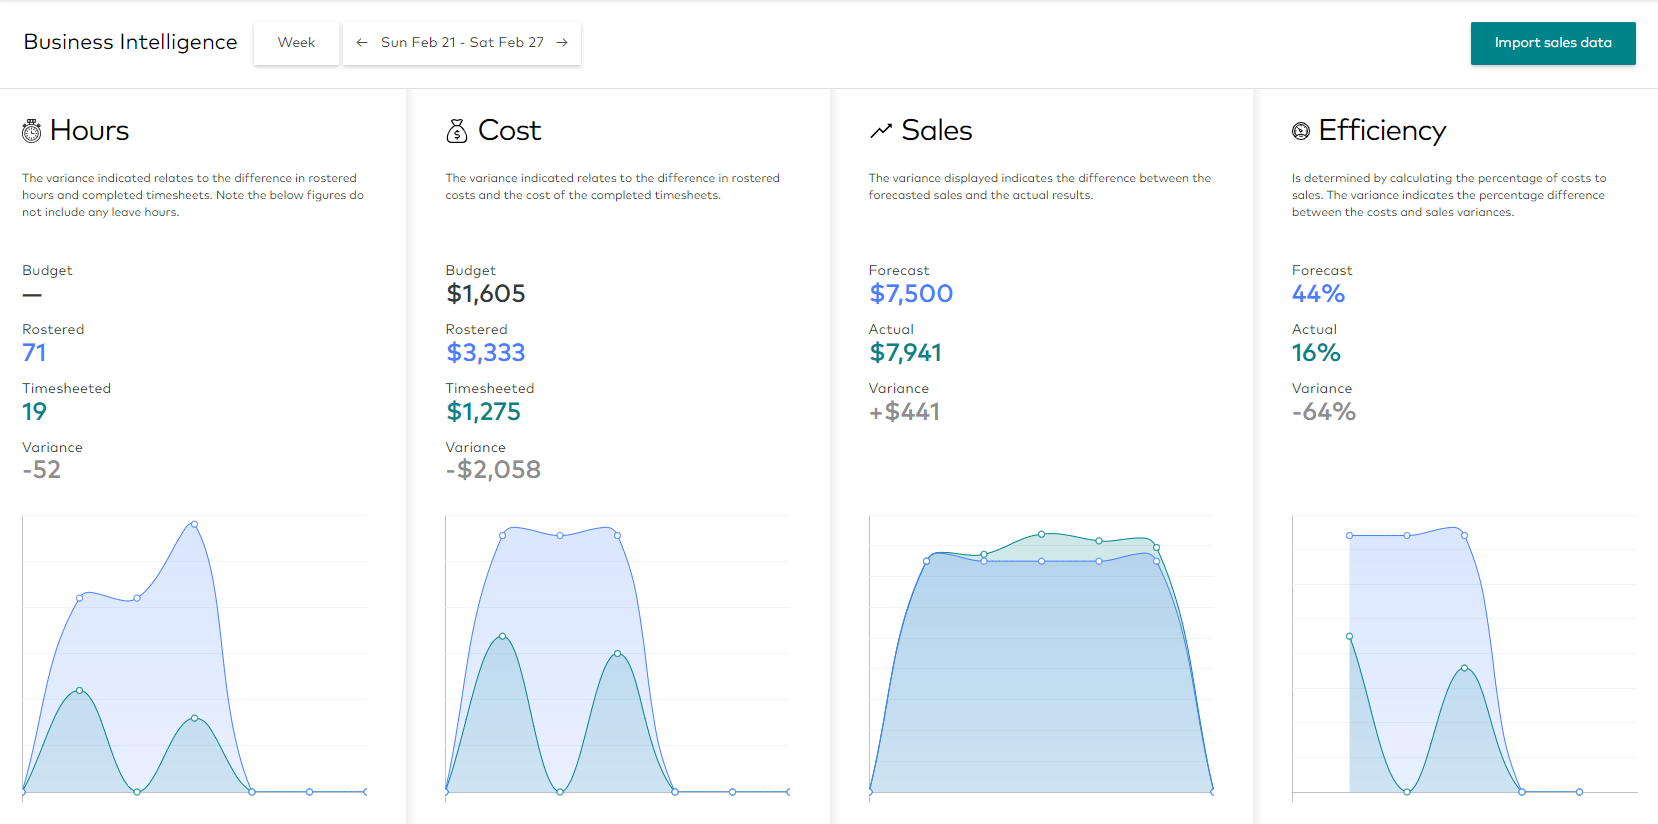
Business Intelligence is a technology-based process that creates a simplified report to analyse data and presents pragmatic information which helps executives and managers make sustainable decisions. It encompasses the entirety of the system's applications and methodologies that enables collection of data from internal system and external sources. Below dashboard shows data visualization with analytical results.
A manager with finance access and above will have the ability to use this section. Data is pulled from Roster and Time sections when shifts and timesheets are costed. Shifts are automatically costed when they are published while timesheets when "Approved".
To go to the Business Intelligence page click on Manage > Business Intelligence on the navigation bar.
Navigating Business Intelligence
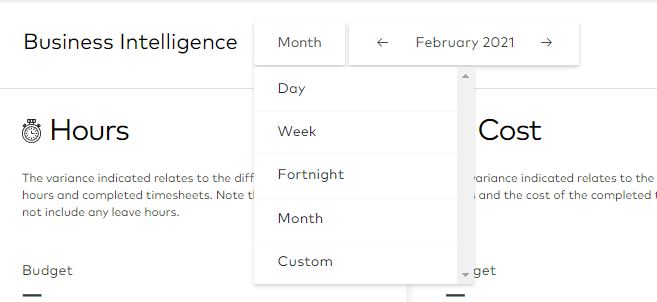
You can change to Day, Week, Fortnight or Monthly view by clicking on the drop-down.
Click on the arrows of the date range picker to navigate between periods of time.
Importing Business Intelligence Data
Some customers wish to import historical as well as budget data into the business intelligence area. This can be done via an Excel import of bulk data into the system.
Data Format
-
File must be in CSV format.
-
Date must be in yyyy-mm-dd format, e.g. 2021-04-30)
-
No spaces in between rows
-
Special characters except for period (.) are not allowed
-
The currency on Sales columns is not allowed
-
Add only up to 2 decimal points
-
Add "0" in blank cells
-
Make sure to select the columns to be imported in the correct order (Forecast Sales, Actual Sales, Budget Hours, Budget Cost, Forecast Units, Actual Units)
-
Row limit is 365 including Header
-
Location column must be the location ID found in Management > Settings > Edit Location. Click the Edit icon for the location the location ID is displayed above the Name.
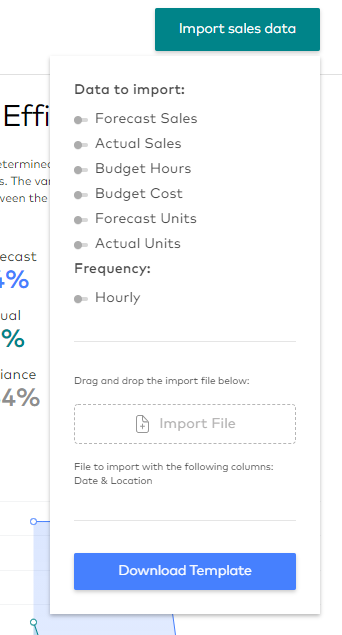
To import, click the Import Sales Data button. Click on Download Template for a file to be used as a guide for the upload format.
Make sure to switch on the data to import for each column your file contains. Make sure you are uploading a .csv file. Drag and drop the sales data file. Click on the uploaded file to import.
Using Business Intelligence
Hours
The Hours section shows total rostered hours and timesheeted hours and the variance between. This does not include any leave hours.
Cost
The cost section shows the total rostered cost and actual timesheeted cost for the period. The variance shows the difference between the two.
Sales
Displays the imported Forecast sales and Actual sales. The variance displayed indicates the difference between Forecast sales and the Actual results.
Efficiency
Is determined by calculating the percentage of costs to sales. The variance indicates the percentage difference between the costs and sales variances.
Capturing Data Automatically and Manually
Imported data in Business Intelligence will automatically be captured in the Add Sales Forecast window in the Roster section. To open this window, double click on the Month of date range.
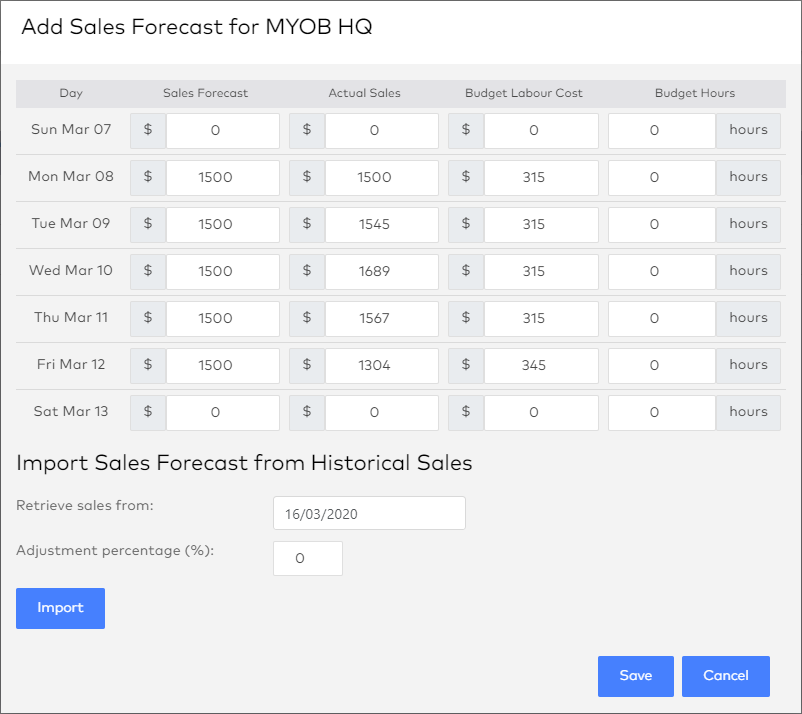
Make sure that the correct location is selected for the correct data to populate. Data can also be manually updated. This is best if your sales data are gathered on a weekly basis, as you can add them in, which will then flow to the BI section for a more comprehensive comparison.
Viewing Data in the Roster Section
To see the data that is imported into the Business Intelligence section, click the Settings icon and select Show Break Down as Table.
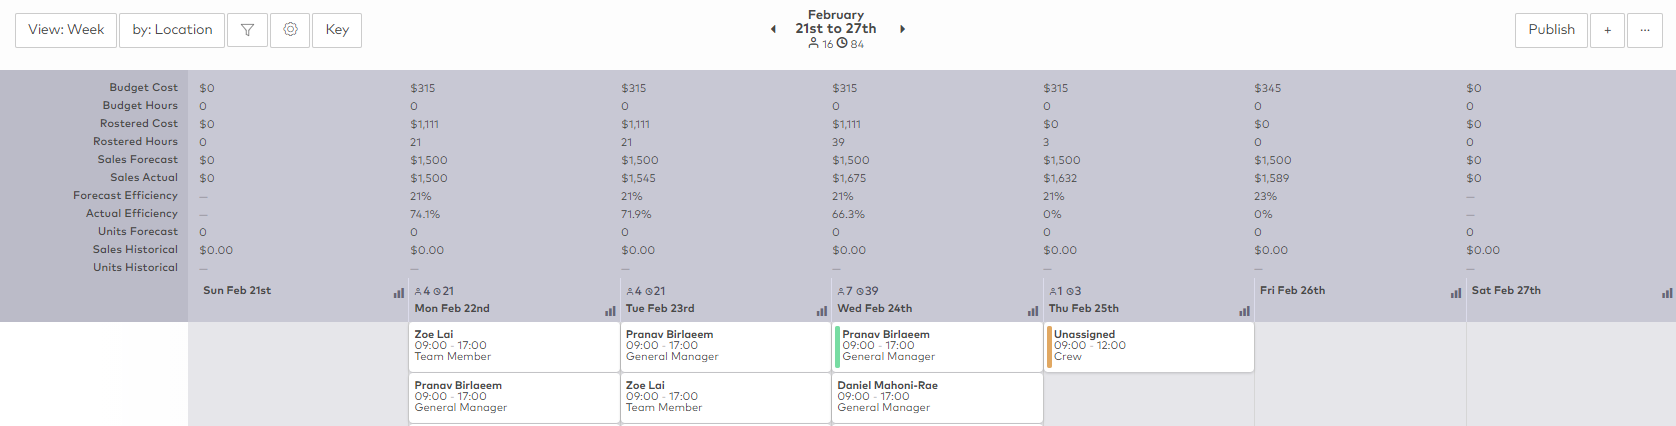
Rostered Hours is the total hours from the shifts per day where the arrow is pointing.
Sales Historical and Units Historical show the imported data from last year. This is dependent on the day where figures do not match on the same date, e.g. Apr 3 2020, does not match Apr 3 2021, as they are not on the same day. The figures in the screenshot moved a day after hence in your imported file data are found on April 4.
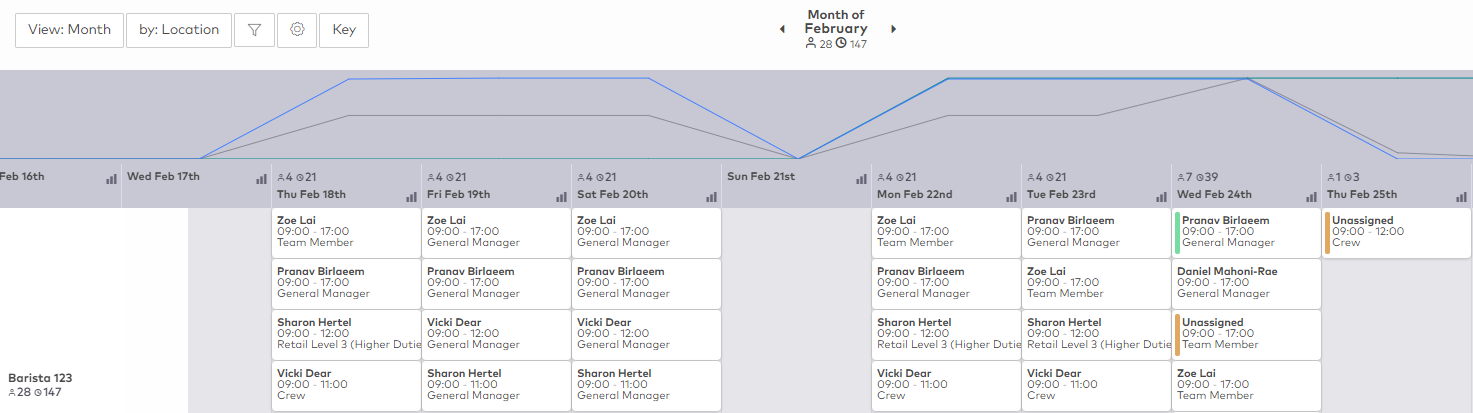
You can also graphically view your sales data by clicking the Settings icon and selecting Show Break Down as Graph. This gives you a clear comparison from the last month's data to your current view.
Sales Forecast, Actual Sales, Budget Labour Cost and Budget Hours can be manually added through the Roster page - see Adding Sales Forecast data in Roster
Any changes to costs in Roster and Time will override the data in Business Intelligence.